 wealth management
Beginner
Emergency Fund: How Much to Save and Where to Keep It
How much to keep in your emergency fund, which accounts to use, and how to balance your safety net with long-term wealth building.
wealth management8 min read
The capital that would replace your income, the year you would reach it, and what each extra point of savings changes. All in today's money.
What you would draw each year. 4% is the reference, 3% the cautious version.
An assumption, not a promise — 5 to 7% for a long-horizon allocation
2% is the European Central Bank's target
Everything is computed in your browser. Your amounts are never sent, stored or shared.
Enter your income and your savings to see the capital you need.
The capital you need
—
The capital that, drawn at the rate you choose, would cover your spending without a salary.
Your savings rate
—
You live on
—
Excluding tax on withdrawals, which depends on your country and your wrapper. Return, inflation and withdrawal rate are assumptions you entered.
Free, no card required. Your data stays yours.
Financial independence is one division: your annual spending divided by the rate at which you will draw down your capital. At 4%, that means multiplying by 25 — €25,200 of annual spending calls for €630,000. Every calculator on the subject stops there, which is a pity, because the number is not the interesting question.
The interesting question is: when? And the answer barely depends on your income. A household on €3,000 saving €900 and a household on €6,000 saving €1,800 have the same savings rate, 30%, and the same arrival date to within a rounding. The second aims at a target twice as large, but reaches it twice as fast. The two effects cancel exactly.
What remains, once income is neutralised, is the savings rate — and it works TWICE. Going from 30% to 40% adds a third to the monthly contribution and takes a tenth off spending at the same time, so €90,000 off the target. On our assumptions, the arrival moves from 28.8 years to 21.9: seven years gained for ten points. Going from 40 to 50 gains five and a half more. The table on this page runs that calculation on YOUR figures, and it is the only genuinely useful thing it has to show.
Two cautions, because the arithmetic is clean and life is not. The 4% rule comes from a 1998 American study covering thirty-year retirements; someone stopping at forty has fifty years ahead, and the margin thins. That same study says nothing about tax on withdrawals, which depends on country and wrapper. A 3% rate costs a third more capital and absorbs both.
And one remark worth more than the rest: a 50% savings rate is never reached by halving your spending. It is reached by not letting spending follow income — the only decision on this page, and it is taken every time the salary goes up.
First by a wide margin. Ten points more take five to seven years off, and the effect does not fade as it climbs: it is the only lever acting on the contribution and the target at once.
The quietest and the heaviest. Going from 4% to 3% multiplies the target by 1.33 and adds a good ten years. That is the price of caution, and it is paid in time.
It works without you, and its weight grows with the years. Ten years of head start on an existing capital is worth more than ten points of savings found halfway through.
The one quoted first and controlled least. Take the low end of the range: an optimistic assumption is only corrected by discovering, too late, that five years are missing.
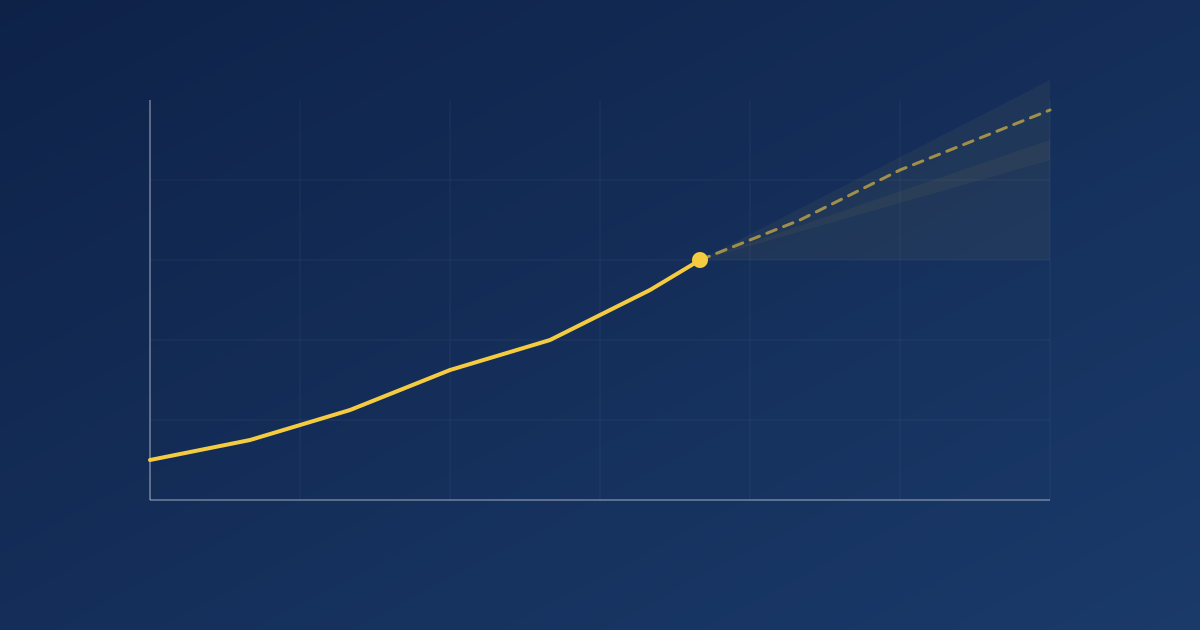
Before aiming for independence, two things are worth doing in order: holding an emergency fund, because one unplanned expense paid on credit wipes out three years of effort, and [taking stock of what you already have](netWorth), because a projection is only as good as its starting point. Only then does the question of the monthly amount become useful — and the path of a real portfolio never looks like the smooth curve on this page.
Here you type what you believe you set aside. Patrice observes it: it keeps your wealth up to date month after month, and the gap between intended and actual savings is the first thing you see.
Free, no card required. Your data stays yours.
wealth managementHow much to keep in your emergency fund, which accounts to use, and how to balance your safety net with long-term wealth building.
 wealth management
Learn why and how to simulate your wealth evolution over 5, 10 or 25 years. Realistic scenarios, compound returns and smarter decision-making.
 wealth management
How inflation affects each asset type, why nominal returns are misleading, and how to measure the real performance of your wealth.
What your contributions become, after fees and with inflation removed.
Any countryOpen the toolFor the same savings effort, the net amount at retirement, by wrapper.
Open the toolThree contracts side by side: what fees take away over the whole period.
Any countryOpen the tool