 wealth management
Intermediate
Inflation and Wealth: Protect Your Purchasing Power
How inflation affects each asset type, why nominal returns are misleading, and how to measure the real performance of your wealth.
wealth management9 min read
Three contracts, the same savings effort and the same gross return: the capital each one leaves you, and what the gap is worth in euros.
Your figures are never transmitted: the calculation runs on your device. Only anonymous audience measurement (page view, click) is recorded, with no figures at all.
Capital at the end
Maximum shortfall: €18,906 between the cheapest and the most expensive contract.
With no fees at all, the same effort would have produced €117,624.
The most expensive contract amounts to a net return of 3.1 % instead of the gross rate advertised.
A calculation, not advice — the assumptions are set out in the FAQ.
Opens your browser's print dialog — choose “Save as PDF”.
| Item | Online contract | Bank contract | Managed portfolio |
|---|---|---|---|
| Total paid in | €60,000 | €60,000 | €60,000 |
| Entry fees paid | €0 | €1,200 | €1,800 |
| Management and advisory fees paid | €5,628 | €10,973 | €15,697 |
| Total fees | €5,628 | €12,173 | €17,497 |
| Capital at the end | €109,178 | €98,710 | €90,271 |
| Shortfall against a fee-free contract | €8,446 | €18,914 | €27,353 |
| Equivalent net return | 4.5 % | 3.8 % | 3.1 % |
| Share of the capital taken by fees | 7.2 % | 16.1 % | 23.3 % |
| Year | Total paid in | Online contract | Bank contract | Managed portfolio |
|---|---|---|---|---|
| Year 1 | €2,400 | €2,458 | €2,401 | €2,370 |
| Year 2 | €4,800 | €5,026 | €4,897 | €4,819 |
| Year 3 | €7,200 | €7,708 | €7,489 | €7,349 |
| Year 4 | €9,600 | €10,511 | €10,183 | €9,964 |
| Year 5 | €12,000 | €13,440 | €12,982 | €12,665 |
| Year 6 | €14,400 | €16,499 | €15,890 | €15,457 |
| Year 7 | €16,800 | €19,695 | €18,911 | €18,342 |
| Year 8 | €19,200 | €23,035 | €22,051 | €21,323 |
| Year 9 | €21,600 | €26,524 | €25,313 | €24,404 |
| Year 10 | €24,000 | €30,169 | €28,702 | €27,587 |
| Year 11 | €26,400 | €33,977 | €32,224 | €30,876 |
| Year 12 | €28,800 | €37,955 | €35,883 | €34,274 |
| Year 13 | €31,200 | €42,112 | €39,685 | €37,786 |
| Year 14 | €33,600 | €46,455 | €43,635 | €41,415 |
| Year 15 | €36,000 | €50,992 | €47,739 | €45,165 |
| Year 16 | €38,400 | €55,733 | €52,004 | €49,040 |
| Year 17 | €40,800 | €60,685 | €56,435 | €53,044 |
| Year 18 | €43,200 | €65,859 | €61,039 | €57,181 |
| Year 19 | €45,600 | €71,265 | €65,823 | €61,456 |
| Year 20 | €48,000 | €76,913 | €70,793 | €65,874 |
| Year 21 | €50,400 | €82,813 | €75,957 | €70,439 |
| Year 22 | €52,800 | €88,978 | €81,323 | €75,156 |
| Year 23 | €55,200 | €95,419 | €86,899 | €80,030 |
| Year 24 | €57,600 | €102,148 | €92,691 | €85,067 |
| Year 25 | €60,000 | €109,178 | €98,710 | €90,271 |
Payments at the start of the month, performance over the month, ongoing fees charged at the end — the convention insurers use. The gross return is assumed constant; a real market is not.
One point of annual fees does not cost 1% of your capital: it costs 1% EVERY YEAR, on a balance that keeps growing. Over twenty-five years, 1.8% of annual fees against 0.5% takes close to a quarter of the final capital — without anyone ever sending you an invoice.
Three families of fees stack up, and they are not visible in the same place. ENTRY fees are taken from every payment: 3% on €200 a month is €6 that will never work for you. MANAGEMENT fees are taken from the balance, so they grow with it. ADVISORY fees — discretionary mandate, managed portfolio, advice — come on top, and that is often where two otherwise comparable contracts part ways.
What return comparisons do not show: two contracts advertising the same gross return do not hand back the same capital. The gross return is what the fund earns; what you get is what is left of it. That gap is exactly what this simulator puts a number on, in euros and in points of return.
The initial payment, the monthly payment, the period and the gross return are shared by all three columns. Only the fees differ: any gap at the end comes from them, and from nothing else.
It is the gap between the cheapest and the most expensive contract at the end, in euros. Compare it with the total you will have paid in: the proportion is more striking than the fee percentage.
The rate that, with no fees at all, would have produced the same capital. It is the honest translation of a fee schedule: 5% gross with 1.8% of fees is not 3.2% net, it is slightly less, because entry fees weigh too.
Add ten years to the period and watch the shortfall: it does not rise by ten years of fees, it rises far more. Same mechanics as compound interest, taken in reverse.
Once the gap has a number, the question is no longer “is this contract expensive?” but “what am I getting in return?”. A management mandate costing 0.6% a year has to beat its index by 0.6% a year just to break even. It rarely does, and that is the only question worth asking. See also what inflation takes on top, and how [tax](flatTax) applies to what is left.
A simulator works on assumptions. Patrice tracks your actual contracts, their value and their payments, and shows what each one returned net. The account is free; the demo shows the app with sample data.
Free, no card required, no connection to your bank accounts.
wealth managementHow inflation affects each asset type, why nominal returns are misleading, and how to measure the real performance of your wealth.
 taxation
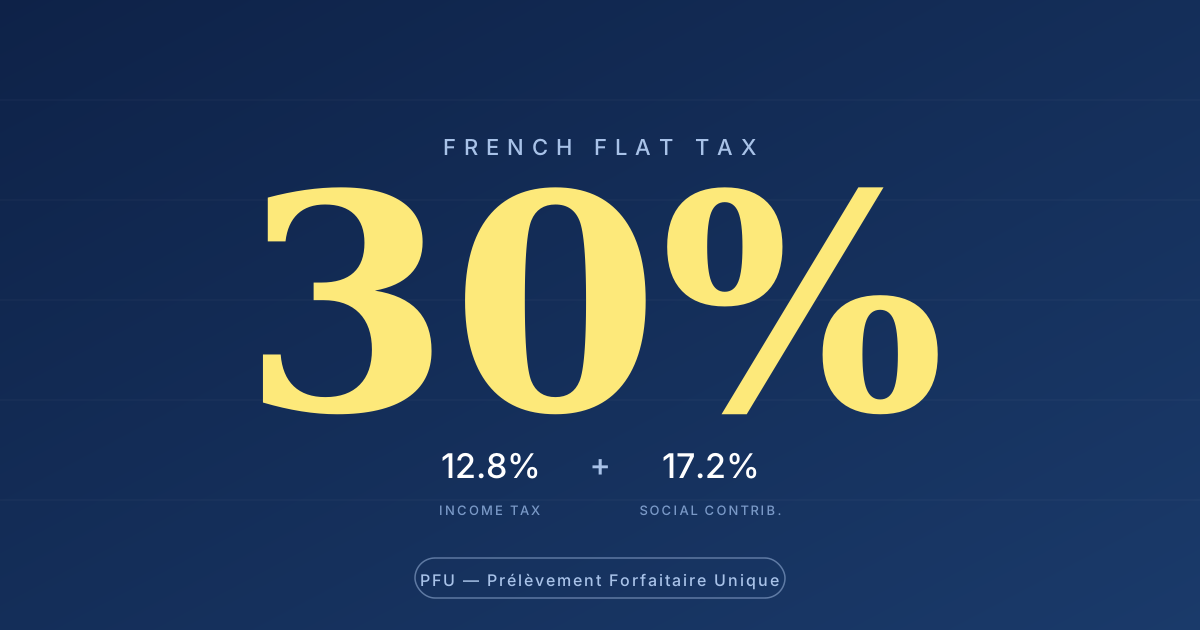
France's default investment tax — 30% on dividends, interest and capital gains outside tax wrappers. What it covers, what it skips, and when the progressive option beats it.
 investment
Why and how to diversify your wealth. Asset classes, correlations, common mistakes and a practical method to reduce risk without sacrificing returns.
A short questionnaire to place your risk tolerance, and what it implies.
Open the toolFour fields, your net worth, and where you stand against the median for your age.
Open the toolThe official, free registries to find what is lying dormant in your name.
Open the tool